System Data & macOS
How to Check SSD Health on Mac: From Disk Utility to Terminal Wear Metrics
If your Mac feels sluggish, freezes during disk-heavy tasks, or you want to inspect your internal SSD's health indicators and estimated endurance, learning how to check ssd health is a useful maintenance skill. Performance problems can have several causes, so an SSD health check should be treated as one part of troubleshooting rather than proof of drive failure.
 Diskfern Team9 min readUpdated
Short answer
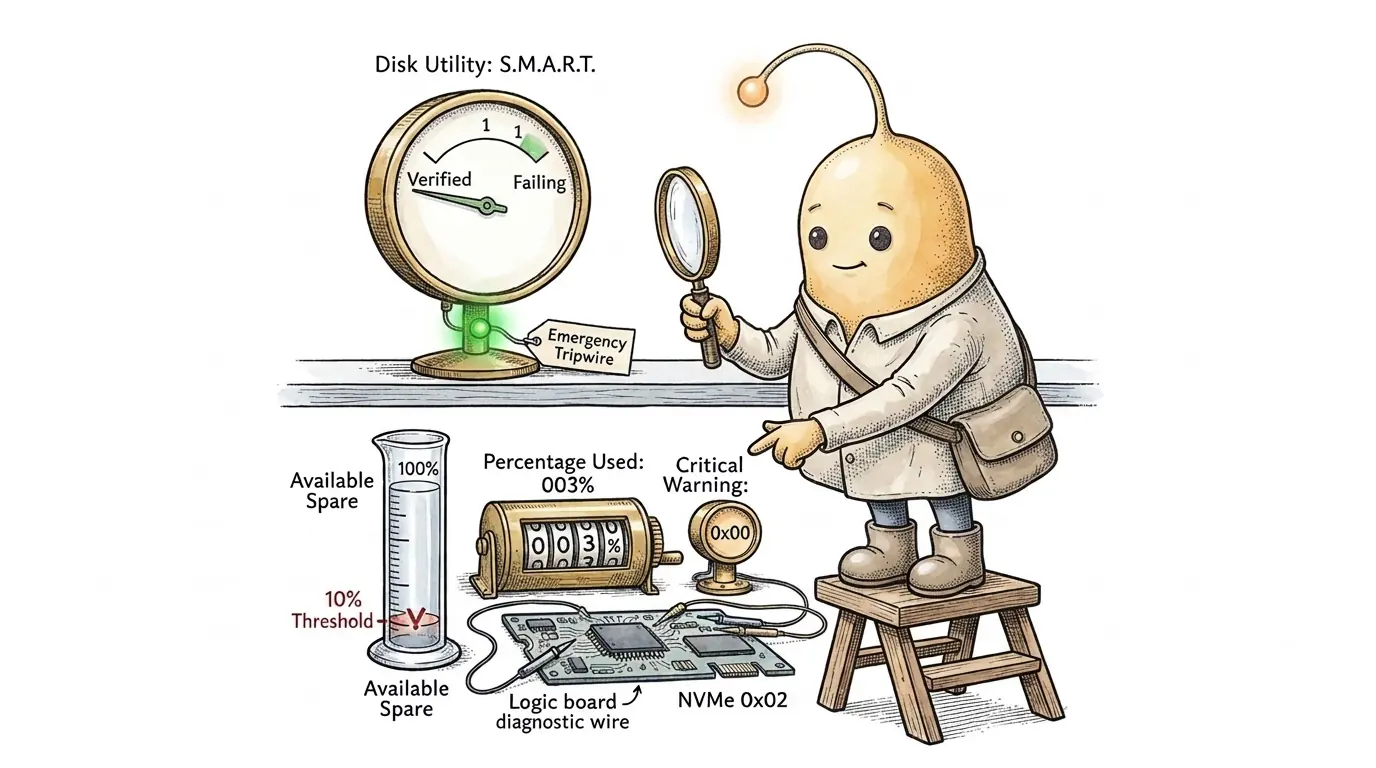
macOS provides two completely different levels of diagnostic information: Disk Utility can display a basic S.M.A.R.T. status (Verified or Failing) when exposed by the drive, while smartctl in Terminal queries the NVMe health log on supported Macs to report Percentage Used, the Available Spare percentage, which represents the remaining spare capacity reported by the SSD controller, and total host data written through the Data Units Written counter.
Method 1: The Quick Built-In Check (Disk Utility)
Disk Utility can display S.M.A.R.T. status when the selected storage device exposes that information to macOS. The information available depends on the device and storage interface.
Steps to check S.M.A.R.T. status:
- Open Disk Utility (press Command + Space, type Disk Utility, and press Return).
- Click the View menu in the top-left toolbar and select Show All Devices (or press Command + 2).
- In the sidebar, select the top-level physical drive (e.g., APPLE SSD AP0512R or Apple Fabric Type 1), rather than the indented APFS container or volumes underneath it.
- Look at the information panel at the bottom of the window, or click the Info (ⓘ) button in the toolbar (the exact placement can vary across macOS versions).
- Locate the S.M.A.R.T. status field: Verified indicates that the device's reported S.M.A.R.T. status does not currently indicate a failure condition. It does not guarantee that every health metric is normal or that the drive cannot fail. Failing indicates that the device reports a failure condition. Back up important data immediately and investigate the storage device.
First Aid is not a hardware health test.
First Aid checks and repairs certain filesystem formatting and directory-structure problems. It is not an SSD endurance measurement or a complete physical hardware diagnostic.
Read more: Apple Support: Disk Utility disk information and available space
Why "Verified" Isn't the Whole Story on Modern Macs
Some older Macs allowed internal storage replacement, although the storage design varied by model. Most modern Apple silicon Macs use internal onboard storage as part of Apple's integrated storage architecture. The storage design and serviceability vary by model.
Apple silicon Macs use a hardware-rooted secure boot process involving Boot ROM, LLB, iBoot and LocalPolicy. The LocalPolicy is signed by the Secure Enclave Processor and stored on the internal drive. Even when starting macOS from an external drive, the Mac requires an internal LocalPolicy configuration. Because Apple silicon boot and recovery depend on internal system components and boot-policy data, a severe internal storage failure can prevent normal startup or recovery. The outcome depends on which components are affected.
Verified is a general health indication, not a detailed endurance measurement. A drive may report significant estimated endurance consumption while still reporting no critical S.M.A.R.T. failure condition. Inspect the available health metrics separately where supported.
Read more: Apple Platform Security: Boot process for a Mac with Apple silicon · Apple Platform Security: Startup Disk security policy control
Method 2: The Detailed Method (Terminal & smartctl)
smartctl can retrieve available S.M.A.R.T./NVMe health information on supported Mac storage devices. The attributes exposed depend on the storage hardware and macOS interface.
Step 1: Install smartmontools
If you use the Homebrew package manager, open Terminal (Applications > Utilities > Terminal) and run:
brew install smartmontools(If you do not have Homebrew, you can install it in seconds from brew.sh, or use a standalone GUI monitoring tool like DriveDx.)
Step 2: Query your internal SSD
Identify your primary drive identifier (typically disk0 for the internal NVMe storage) and run smartctl with administrator privileges:
sudo smartctl -a disk0Type your Mac administrator password when prompted (Terminal will not display characters while typing) and press Return.
Step 3: Read the NVMe Health Log
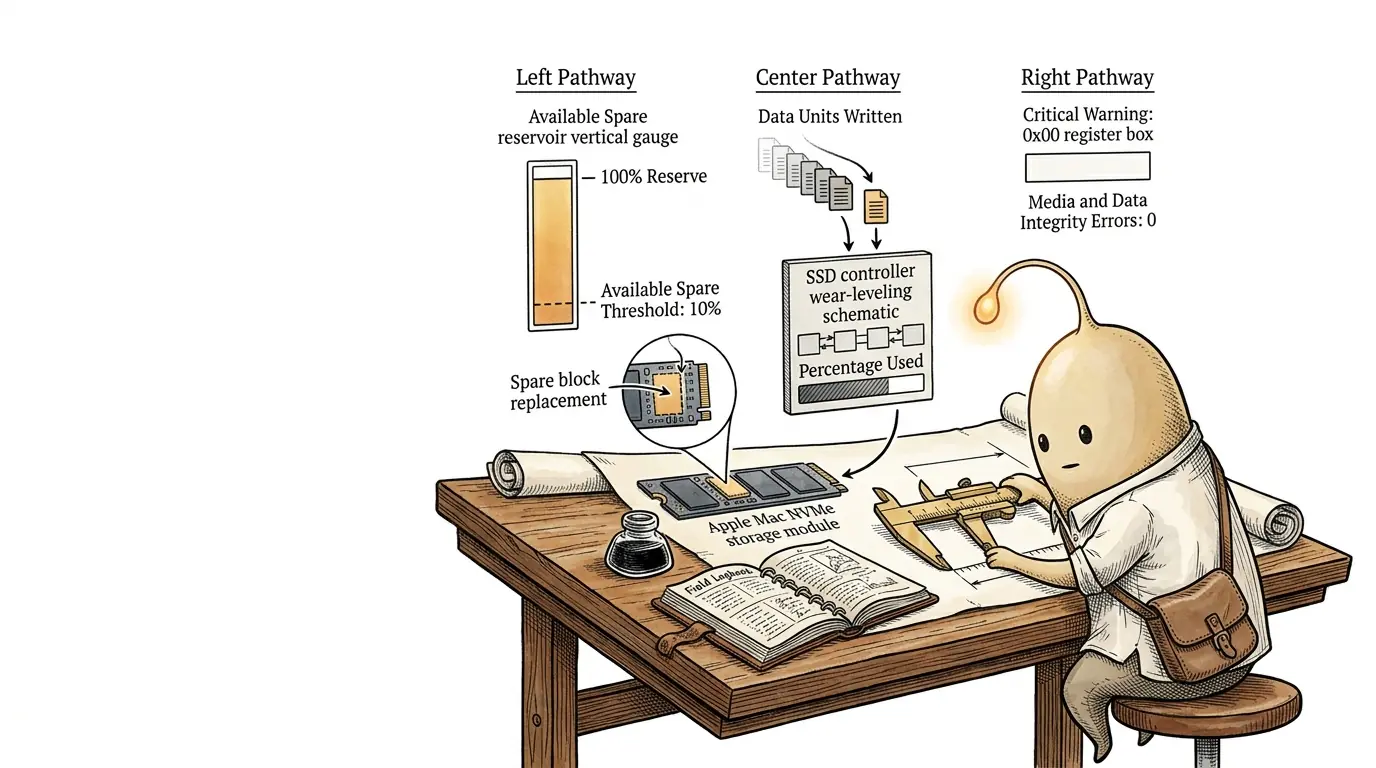
Scroll down until you locate the section labeled SMART/Health Information (NVMe Log 0x02). The following is an illustrative example of NVMe S.M.A.R.T. output. Actual attributes and values vary by SSD model, controller, firmware and operating system:
=== START OF SMART DATA SECTION ===
SMART/Health Information (NVMe Log 0x02)
Critical Warning:                   0x00
Temperature:                        34 Celsius
Available Spare:                    100%
Available Spare Threshold:          10%
Percentage Used:                    3%
Data Units Read:                    45,210,812 [23.1 TB]
Data Units Written:                 38,419,004 [19.7 TB]
Host Read Commands:                 612,401,980
Host Write Commands:                491,120,443
Controller Busy Time:               1,240
Power Cycles:                       312
Power On Hours:                     1,840
Unsafe Shutdowns:                   14
Media and Data Integrity Errors:    0
Error Information Log Entries: 0Error Information Log Entries counts error-log entries recorded over the controller's lifetime. It is separate from the Media and Data Integrity Errors counter and should be interpreted with the corresponding error information.
Read more: smartmontools: smartctl manual (Darwin / macOS device support)
How to Decode Your SSD's Health Metrics
The NVMe specification standardizes health reporting for NVMe-compatible storage devices through its SMART/Health Information log. Here is how to evaluate the reported attributes:
| NVMe Attribute | What It Measures | What to Watch |
|---|---|---|
| Critical Warning | Controller-reported hardware warning bitmask (spare, temperature, reliability, read-only) | Any active non-zero flag indicates a reported hardware warning condition |
| Available Spare | Normalized remaining spare-capacity percentage reported by the controller | Below reported threshold raises an NVMe warning; a declining trend warrants monitoring |
| Available Spare Threshold | Controller-defined minimum spare-capacity floor | Device-specific percentage; Critical Warning Bit 0 triggers when spare falls below it |
| Percentage Used | Vendor-specific estimate of consumed NVM subsystem endurance | 100% indicates estimated endurance has been consumed; values above 100% are permitted and do not necessarily indicate device failure |
| Data Units Written | Cumulative host data written to the controller in units of 512,000 bytes | No universal failure threshold; compare cumulative writes against your workload over time |
| Media & Data Integrity Errors | Occurrences of unrecovered data-integrity errors detected by the controller | Investigate non-zero counts, check for increasing trends, and maintain regular backups |
Understanding "Percentage Used"
Under the NVMe specification, Percentage Used is a vendor-specific estimate of consumed NVM subsystem endurance. A value of 100% means the estimated endurance has been consumed, but does not necessarily indicate device failure. Values above 100% are permitted. Monitor Percentage Used periodically to understand estimated endurance consumption, and maintain regular backups regardless of the reported percentage.
Read more: NVM Express Base Specification: SMART / Health Information Log (Log Page 02h)
What Influences Mac SSD Write Activity and Degradation?
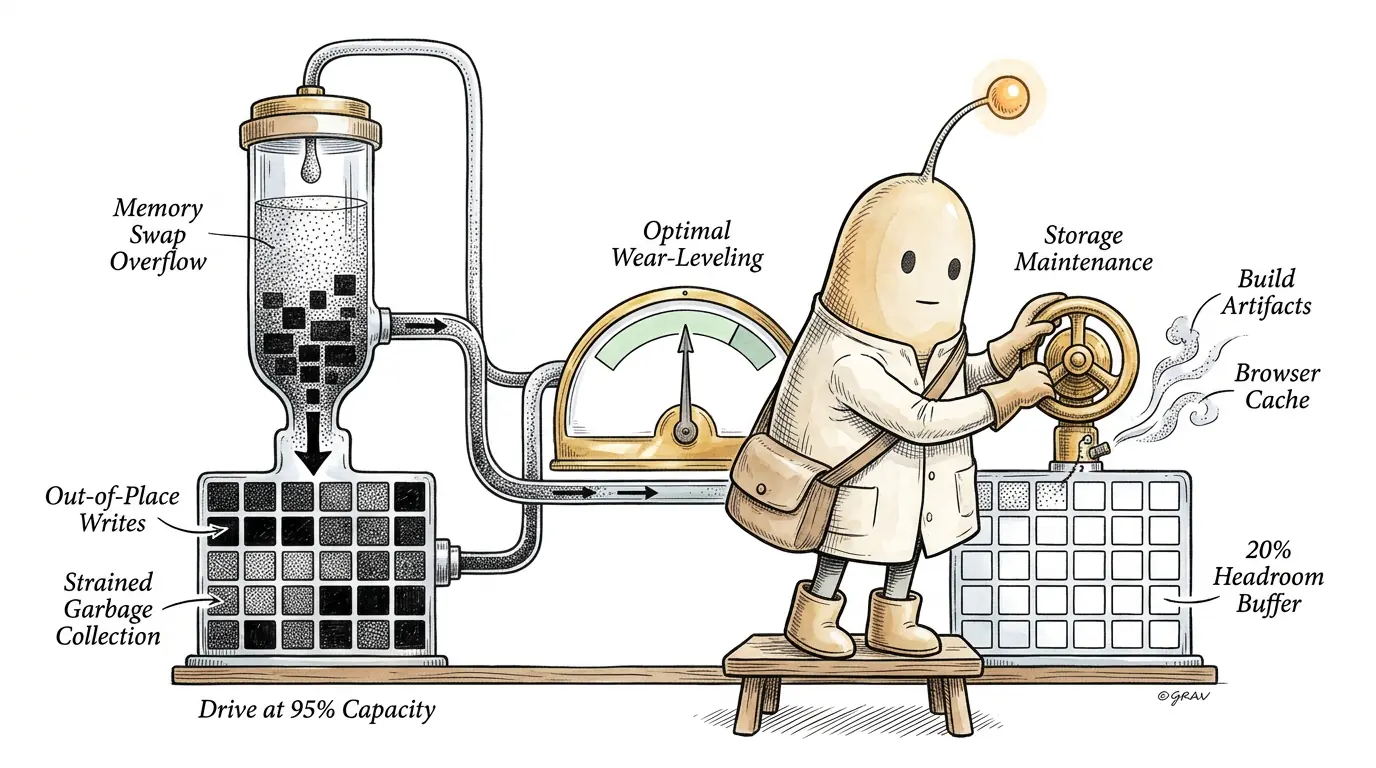
SSD endurance is primarily affected by writes and NAND program/erase (P/E) cycles. Normal read operations contribute negligible wear, although repeated read activity can introduce read-disturb effects in NAND flash. Several workload and storage-management factors can influence SSD write activity and endurance: 1. Virtual Memory Swap Activity: When memory pressure increases, macOS can compress inactive memory and use storage on the startup disk for swap files. On memory-constrained Macs running sustained memory-intensive workloads, macOS may use more swap storage. Repeated swap activity can contribute to additional SSD host writes. 2. Storage Capacity and Write Amplification: NAND flash is programmed in pages and erased in larger blocks containing multiple pages. Their sizes vary by NAND technology and SSD implementation. SSDs use out-of-place writes: when available clean blocks become scarce, the controller may need to perform garbage collection, moving valid pages and erasing blocks to create room for new writes. Operating an SSD with very little available space can reduce the controller's flexibility for garbage collection and may increase write amplification, particularly under write-intensive random workloads. The actual effect depends on the SSD's over-provisioning, TRIM support, and workload. 3. Cache and Temporary File Turnover: Downloading, updating, importing, or converting local AI models can generate substantial writes. Once loaded, model weights are generally read for inference, while additional cache and log writes depend on the application and workload. Xcode builds, video scratch disks, and package-manager operations can also generate writes over time.
Practical Checklist: Storage Practices for Mac SSDs
You do not need to obsess over every write cycle, but four practical habits help you manage storage capacity and monitor drive health effectively:
- Maintain sufficient free storage capacity: Diskfern recommends maintaining 15% to 20% free storage as a practical housekeeping target. This helps provide sufficient headroom for macOS updates, temporary files, and controller garbage collection under write-heavy workloads. This is not an official Apple or NVMe requirement and does not guarantee longer SSD lifespan.
- Monitor memory pressure in Activity Monitor: Open Activity Monitor > Memory. Consistently yellow or red memory pressure, particularly alongside sustained swap activity, may indicate that your Mac is under memory pressure. Remember that Swap Used is the current amount of disk space allocated to swap, not a cumulative SSD-write counter. A large Swap Used value alone does not establish how much data has been written to the SSD.
- Offload static, massive media libraries: Move completed video exports, raw archives, and static sample libraries to an external USB or Thunderbolt drive rather than leaving your internal drive at near-full capacity.
- Periodically review large files and dormant data: Use built-in tools or a dedicated storage utility. Diskfern (diskfern.com), for example, is a native macOS storage analyzer that maps disk usage visually, flags heavy developer artifacts like Xcode simulators and build caches, and helps you identify disposable files so you can reclaim storage capacity.
How to check SSD health in Terminal
These instructions apply to Mac configurations supported by smartmontools. SMART/NVMe information availability depends on the internal storage hardware, macOS interface, and smartmontools version. Some devices may expose only limited information or no readable SMART data. Installing smartmontools changes your system by adding the utility. The smartctl -a command retrieves health information and does not intentionally modify the SSD's data.
- 1
Install smartmontools via Homebrew.
$brew install smartmontoolsHomebrew must be installed first. See brew.sh for installation instructions.
- 2
Run a full health report on your internal SSD.
$sudo smartctl -a disk0Replace disk0 with your internal drive identifier if different. Confirm with diskutil list.
- 3
Locate the SMART/Health Information (NVMe Log 0x02) section.
Check Critical Warning (0x00 indicates no reported warning flags), Available Spare (relative to the reported threshold), and Percentage Used.
- 4
For external drives, verify whether your enclosure and macOS support S.M.A.R.T. passthrough.
For external NVMe or SATA drives, S.M.A.R.T. access depends on the USB enclosure's bridge chipset, its firmware, and macOS driver and pass-through support. Not all enclosures expose S.M.A.R.T. data to macOS. Check the supported device types in the installed smartmontools version before using a bridge-specific command.
The Diskfern way
How Diskfern helps
Diskfern helps you identify storage-heavy files and developer artifacts so you can reclaim disk space and better manage available storage capacity.
- Run a free read-only scan with Diskfern to visualize storage distribution across your internal SSD.
- Identify large developer artifacts, simulator runtimes, and local AI model caches that consume valuable disk capacity.
- Review and remove files that are no longer needed to reclaim storage on your Mac.
Finding and reviewing is free. Moving items to the Trash from Diskfern is part of Pro.
Download DiskfernQuestions
Can I replace the internal SSD if it fails on an Apple silicon Mac?
On the MacBook Air, MacBook Pro, iMac, and Mac mini, the flash storage chips are onboard and cannot be replaced by users. On the Mac Studio and Mac Pro, the flash modules are removable proprietary cards; however, they require firmware pairing using a second Mac with Apple Configurator in DFU mode.
What should I do if Available Spare begins declining?
If Available Spare falls toward the controller's reported threshold, the drive is consuming its spare capacity to replace degraded sectors. When Available Spare falls below the threshold, the controller raises a Critical Warning. Maintain regular backups and arrange for hardware inspection before data loss occurs.
Can I check S.M.A.R.T. health on an external SSD connected via USB?
For external NVMe or SATA drives, S.M.A.R.T. access depends on the USB enclosure's bridge chipset, its firmware, and macOS driver and pass-through support. Native Thunderbolt enclosures generally pass commands directly, while USB enclosures require bridge translation that macOS may not support. Not all external enclosures expose S.M.A.R.T. data to macOS. Consult the installed smartmontools documentation for device-specific compatibility.

Written by
Diskfern Team
We explain Mac storage using product behavior and the sources listed below. Review your app settings and backups before removing data.
Sources
- Apple Support: Disk Utility disk information and available space · checked November 12, 2026
- Apple Platform Security: Boot process for a Mac with Apple silicon · checked November 12, 2026
- Apple Platform Security: Startup Disk security policy control · checked November 12, 2026
- Apple Support: View memory usage in Activity Monitor · checked November 12, 2026
- NVM Express Base Specification: SMART / Health Information Log (Log Page 02h) · checked November 12, 2026
- smartmontools: smartctl manual (Darwin / macOS device support) · checked November 12, 2026
- SNIA: Endurance of NVMe, SAS, and SATA SSDs · checked November 12, 2026
- IBM Research: Performance of Greedy Garbage Collection in Flash-Based Solid-State Drives · checked November 12, 2026
- Yu Cai et al. (IEEE/IFIP DSN 2015): Read Disturb Errors in MLC NAND Flash Memory · checked November 12, 2026
Keep reading
Continue exploring macOS system storage, safety principles, and triage.
SSD NVMe on a Mac: Choosing an External Enclosure
Learn how to use an SSD NVMe with your Mac. Compare external enclosures, USB4 speeds, compatibility, APFS and exFAT formats, and setup.
External drive storage on Mac
See how much space is used on an external drive in Finder, Get Info or Disk Utility, then find the files filling it up. Works for USB and SSD drives.
1TB SSD PS5: Can I use it on Mac?
Can you use a 1TB PS5 SSD on a Mac? Learn how external USB and internal M.2 NVMe formats compare, why formatting wipes games, and when exFAT works.
Mac storage full: what to delete first
A practical, safety-first order for what to check when your Mac says storage is almost full, starting with the easiest wins and ending with what to leave alone.
Disk space analyzer
Map readable folders, then move from the big picture to individual files without losing your place.

Get your space back. Start with a free scan.
Explore the files and folders Diskfern can read. Your files stay on your Mac, and nothing is removed until you say so.
macOS 14 Sonoma or later · Apple silicon and Intel